 ActivityMonitor
| Per la Laborstrio: | ||
| Per la Spurilo: | /boot/system/apps/ActivityMonitor | |
| Dosieroj de agordo: | ~/config/settings/ActivityMonitor settings |
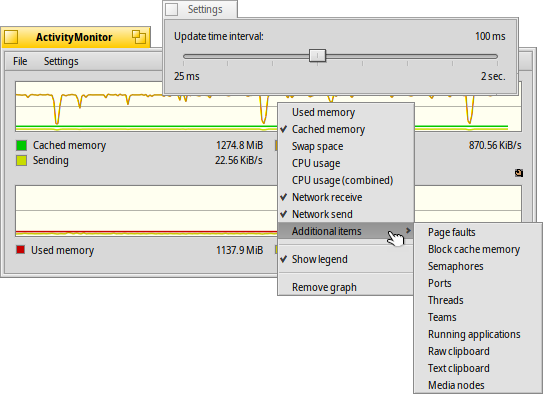
You can track system resources by launching the ActivityMonitor and activating different items of interest.

By right-clicking into the window, you can toggle the display of all kinds of resources:
Used/Cached Memory, Swap Space, CPU Usage, Network Receive/Send, Page faults, Semaphores, Ports, Threads, Teams, Running Applications, Raw/Text Clipboard Size, Media Nodes.
Below the graph is a legend (hideable from the context menu). You can change the colors and that of the graph's background via drag & drop from any color picker, e.g. from Icon-O-Matic.
You can add more views from the menu if it gets too crowded.
The menu opens a panel to set the , that is basically how fast the graph is scrolling by. You can also use the mouse wheel on the graph to temporarily change the speed.
Each view has its own Replicant handle and can thus be arranged, for example, on the Desktop.