 Deutsch
 Français
 Italiano
 Русский
 Español
 Svensk
 日本語
日本語 Українська
 中文 [中文]
 Português
 English
 ProcessController
| Deskbar: | ||
| Ort: | /boot/system/apps/ProcessController | |
| Einstellungen: | keine |
 The primary task of ProcessController applet is to show CPU(s) activity and amount of used memory. It allows monitoring of individual processes, change their priority, and kill them if the program freezes. In multiprocessor environments it allows you to disable individual processors/cores. When Tracker or Deskbar crashes you can run it again from ProcessController's menu.
Indicators on the left shows each CPU usage, while the bar on the right shows the memory consumption. Remember that the number of indicators depends on the number of processors in the computer.
If not yet running, launching ProcessController will ask if it should open in window mode or live in the Deskbar tray. In window mode you're able to resize the icon by resizing the window and use the Replicant handle to drag it to the Desktop.
Wherever it's installed, it's operated via a right-click context menu.
To remove the applet again from your tray, uncheck in its context menu.
Quit an application
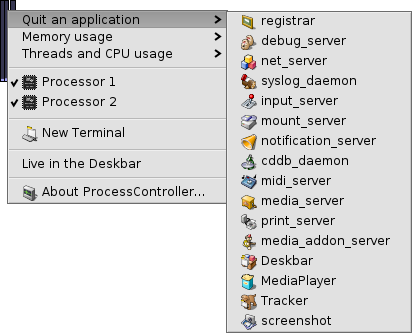
To quit an application just choose it's name from the menu. This is a clean way to close app, just like when you would click the close button. There are some teams that cannot be quitted this way, mostly system processes.
Memory usage

This menu allows you to monitor memory usage of different teams in your system. Next to the team's name there are two columns: first with memory amount reserved for write, while the second shows all memory including read-only space (shared libraries for example).
The first row shows total amount of memory used by system and all applications. The length of the blue bar is based on total physical memory in your computer. The next rows show memory used by each process. Please note that the length of the bar is based only on the used part of memory.
| Memory used only by given application (with write access) | ||
| Memory including read-only space (can be shared with other applications) |
Threads and CPU usage
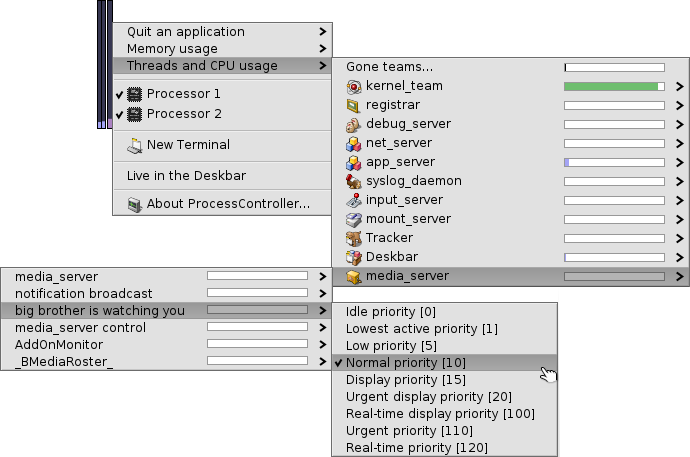
This menu allows you to change thread priorities, kill processes or debug them.
At the first level you see team names, when you click on it, you can kill the whole team. The dark-blue part of the bar is spent in kernel code, the light-blue part in user code, the green part in the idle thread(s). A bar completely filled with blue means that the team is using all processing power.
At the second level there are particular threads. By clicking them you can debug or kill them. A bar completely filled with blue means that the thread is using completely one processor/core.
The last level of the menu allows you to change a thread's priority.
| Kernel code | ||
| User code | ||
| Idle thread |