 Français
 Deutsch
 Italiano
 Русский
 Español
 Svensk
 日本語
日本語 Українська
 中文 [中文]
 Português
 English
 ProcessController
| Deskbar : | ||
| Localisation : | /boot/system/apps/ProcessController | |
| Réglages : | aucun |
 The primary task of the ProcessController applet is to show the activity of your CPU(s) and the amount of used memory. It allows monitoring of individual teams, change their priority, and kill them if the program freezes. In multiprocessor environments it allows you to disable individual processors/cores. When Tracker or Deskbar crash you can restart them from ProcessController's menu.
Les indicateurs de gauche montrent l'activité de chaque processeur, alors que la jauge de droite montre la consommation mémoire. Souvenez vous que le nombre d'indicateurs dépend du nombre de processeur/cœurs de l'ordinateur.
If not yet running, launching ProcessController asks if it should open in window mode or live in the Deskbar. In window mode you can resize the bar-display by resizing the window and then use the Replicant handle to drag it to the Desktop.
Wherever it's installed, it's operated via a right-click context menu.
To remove the applet again from the Deskbar, uncheck in its context menu.
Quitter une application (Quit an application)
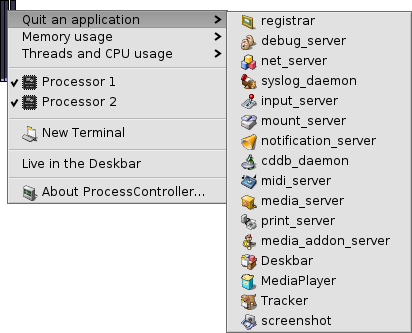
Pour quitter une application il suffit de choisir son nom dans le menu . C'est une méthode propre pour fermer un application, tout comme de cliquer sur son bouton de fermeture. Cependant, veillez à ne pas arrêter les processus du système comme les serveurs ou des démons, au risque d'altérer le bon fonctionnement de votre système.
Consommation mémoire (Memory usage)
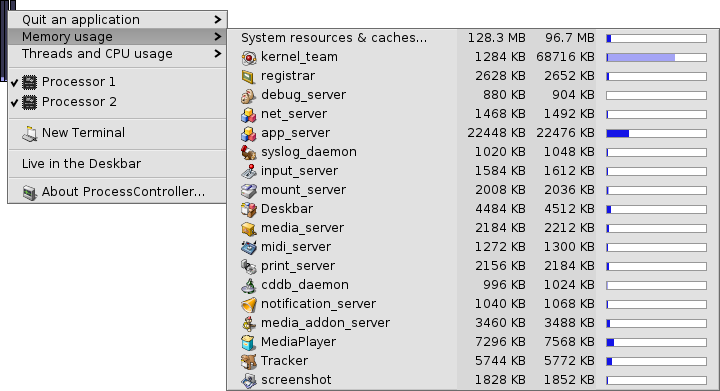
Le suivit de la consommation de mémoire peut être assez imprécis.
This menu allows you to monitor memory usage of different teams in your system. Next to the team's name there are two columns: first with the amount reserved for writable memory, while the second shows all memory including read-only space (shared libraries for example).
The first row System resources & caches... shows the total amount of memory used by the system and all applications. The length of the blue bar is based on the total physical memory in your computer. The next rows show memory used by each process. Note that the length of the bar is based only on the used part of memory.
| Memory used only by given application (with write access) | ||
| Memory including read-only space (can be shared with other applications) |
Tâche et charge du processeur (Threads and CPU usage)
Ce menu vous permet de modifier les priorités des tâches, de tuer les processus ou les déboguer.

| Code noyau | ||
| Code utilisateur | ||
| Tâche oisive |
At the first level you see team names. By clicking on one, you can kill the whole team. The dark-blue part of the bar is time spent in kernel code, the light-blue part in user code, the green part in the idle thread(s). A bar completely filled with blue means that the team is using all processoring power.
The second level shows particular threads of a team. By clicking on one, you can debug or kill it. A bar completely filled with blue means that the thread is pegging one processor/core.
The last level of the menu allows you to change a thread's priority. Be careful with that! As a rule of thumb the priority of a thread should be inverse its CPU usage. That is, the more it tries to claim CPU time, the lower should be it's priority. In general, don't mess with an app's priorities; contact its author, that's his business.